How To Monitor Pod Resource Using Grafana📜
-
Log in to Grafana url with credentials \ To Get Grafana credentials: \ Username:
kubectl get secret monitoring-monitoring-grafana -o jsonpath='{.data.admin-user}' | base64 -dPassword:
kubectl get secret monitoring-monitoring-grafana -o jsonpath='{.data.admin-password}' | base64 -d -
Once logged in and directed to the home page, click the menu Dashboard and then select Manage. \
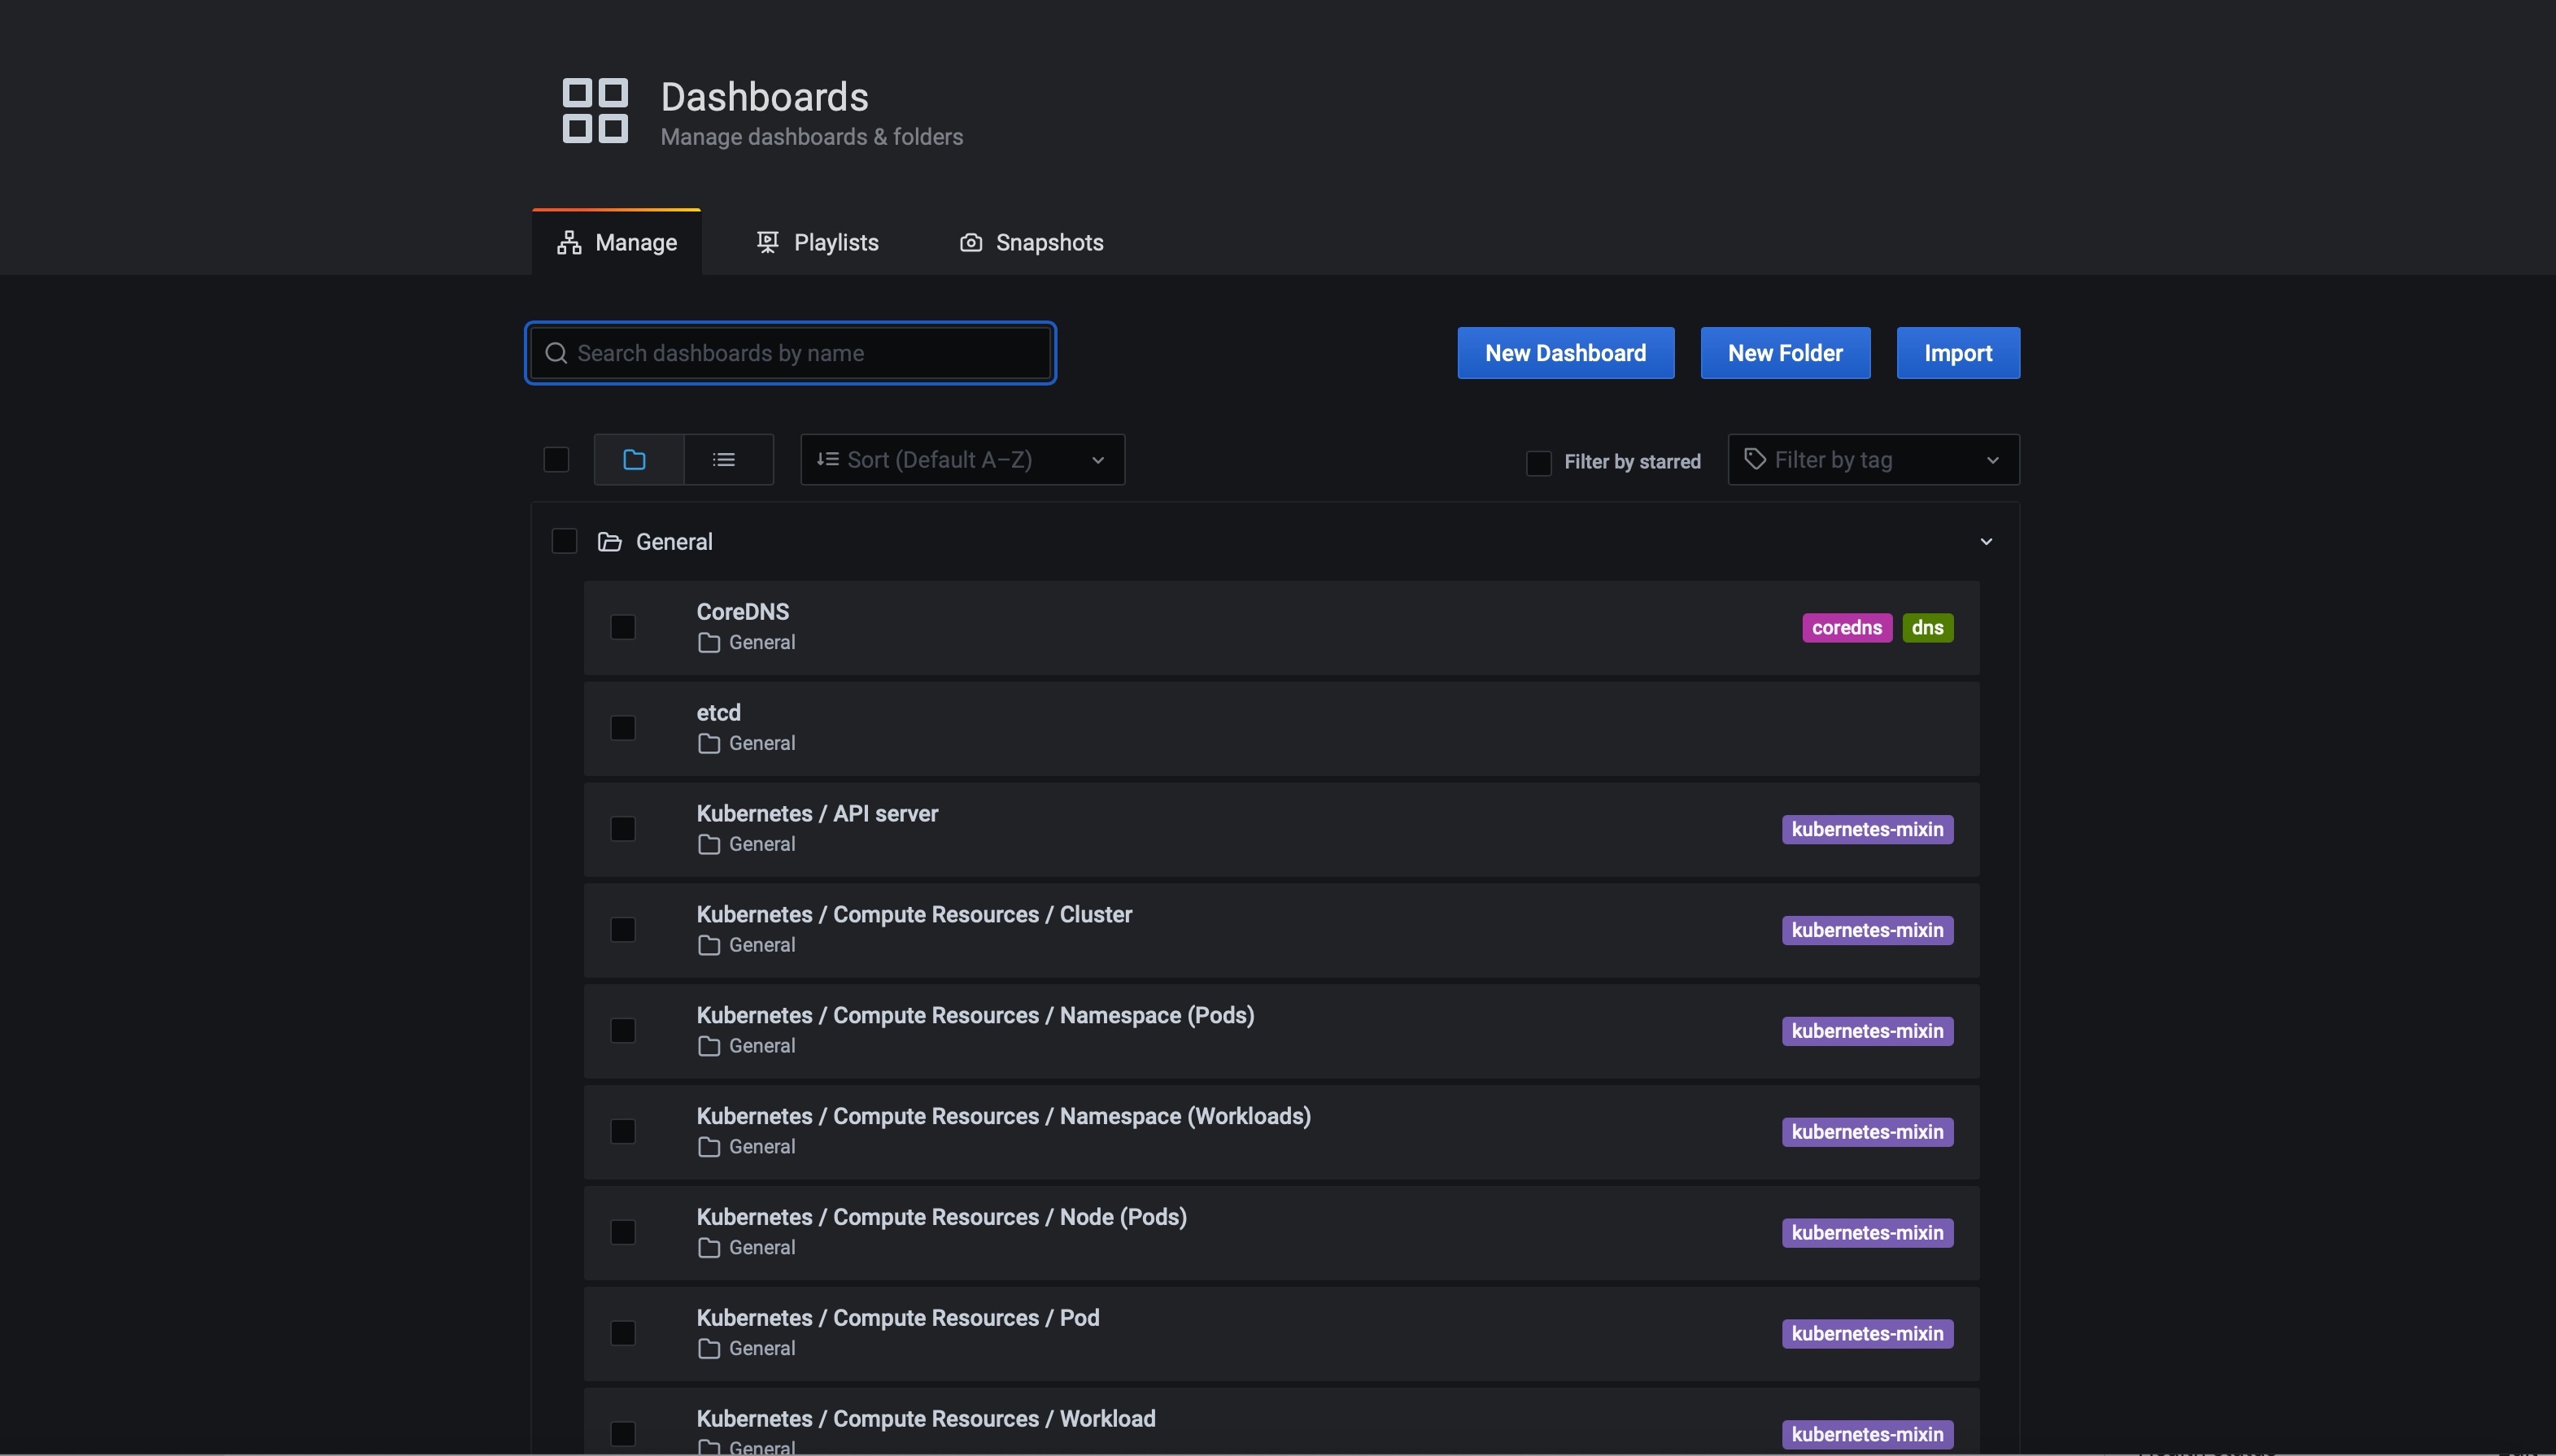
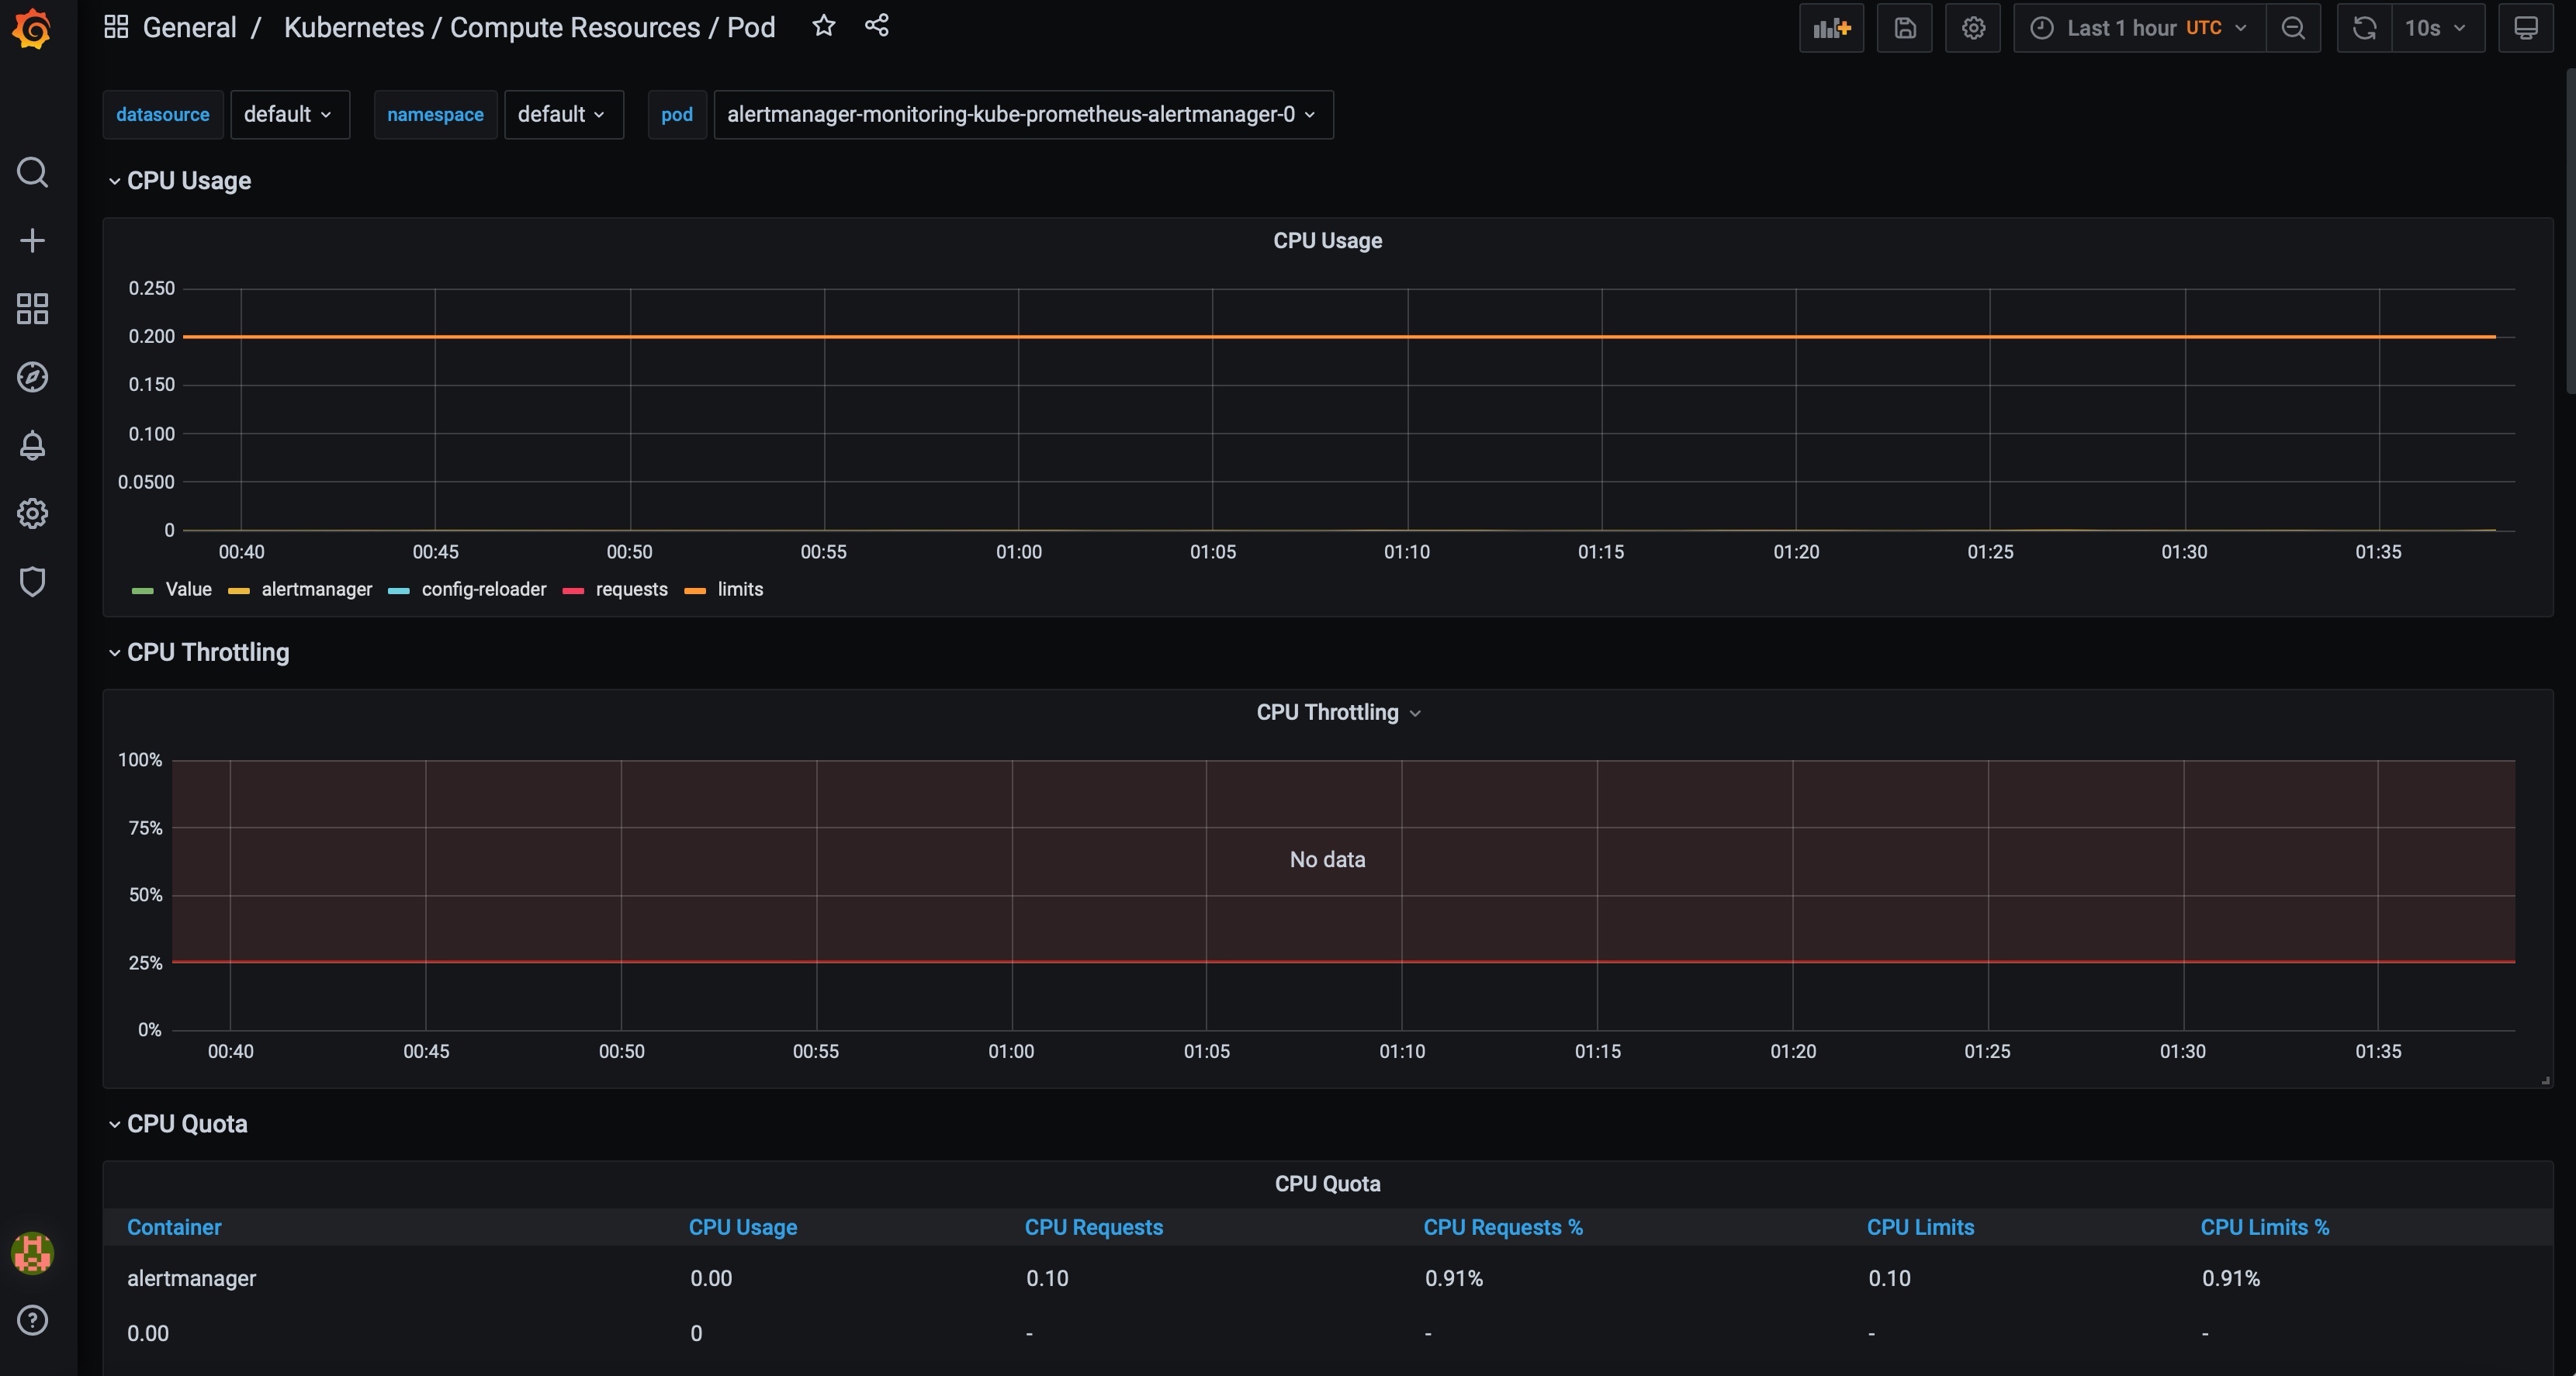
- From the Dashboard select Kubernetes/Compute Resource / Pod . \
This creates a dashboard to monitor the pod resource CPU Usage, CPU Throttling, CPU quota, Memory Usage, Memory Quota, etc. \