Observability Lab📜
This lab explores one of the main strengths of Istio: observability.
The services in our mesh are automatically observable, without adding any burden on developers.
Deploy the Addons📜
The Istio distribution provides addons for a number of systems that together provide observability for the service mesh:
- Zipkin or Jaeger for distributed tracing
- Prometheus for metrics collection
- Grafana provides dashboards for monitoring, using Prometheus as the data source
- Kiali allows us to visualize the mesh
In the Istio distribution these addons are located in the samples/addons/ folder. But as part of BigBang offering, these addons are enabled by default.
Tip
If you find the observability components are not enabled, you can deploy each addon by making sure your values.yaml file contain the following:
jaeger:
enabled: true
monitoring:
enabled: true
kiali:
enabled: true
Upgrade using helm and your values file:
helm upgrade --install bigbang $HOME/bigbang/chart \
--values https://repo1.dso.mil/platform-one/big-bang/bigbang/-/raw/master/chart/ingress-certs.yaml \
--values $HOME/ib_creds.yaml \
--values $HOME/demo_values.yaml \
--namespace=bigbang --create-namespace
-
Verify that the
kialinamespace is now running additional workloads for each of the addons.kubectl get pod -n kiali -
Verify that the
monitoringnamespace is now running additional workloads for each of the addons.kubectl get pod -n monitoring -
Verify that the
jaegernamespace is now running additional workloads for each of the addons.kubectl get pod -n jaeger
With the upstream distribution of Istio, you use istioctl CLI commands for accessing the web UIs for each dashboard. In BigBang you need to edit your /etc/hosts file to associate your public IP with the domains below:
echo $GATEWAY_IP grafana.bigbang.dev kiali.bigbang.dev tracing.bigbang.dev prometheus.bigbang.dev | sudo tee -a /etc/hosts
Generate a load📜
In order to have something to observe, we need to generate a load on our system.
Install a load generator📜
Install a simple load generating tool named siege.
We normally install siege with the apt-get package manager.
However, given the cloud shell’s ephemeral nature, anything installed outside our home directory will vanish after a session timeout.
Alternatives:
- Install from source. It’s a little more work, but does not exhibit the above-mentioned problem.
- Run the load generator from your laptop. On a mac, using homebrew the command is
brew install siege.
Here are the steps to install from source:
-
Fetch the package
wget http://download.joedog.org/siege/siege-latest.tar.gz -
Unpack it
tar -xzf siege-latest.tar.gz -
Navigate into the siege subdirectory with
cd siege -
Run the
configurescript, and request that siege get installed inside your home directory./configure --prefix=$HOME -
Build the code
make -
Finally, install (copies the binary to
~/bin)make install
Feel free to delete (or preserve) the downloaded tar file and source code.
Generate a load📜
With siege now installed, familiarize yourself with the command and its options.
siege --help
Run the following command to generate a mild load against the application.
siege --delay=3 --concurrent=3 --time=20M http://$GATEWAY_IP/
Note
The siege command stays in the foreground while it runs.
It may be simplest to leave it running, and open a separate terminal in your cloud shell environment.
Kiali📜
Launch the Kiali dashboard, open in a new browser tab kiali.bigbang.dev:
Warning
The address above is only resolvable by a browser if you updated your machine hosts file to match it with your instance’s public IP.
Tip
Kiali offers 5 options for authentication. Big Bang will default to using the token method. The token method uses the Kubernetes service account token for authentication. To get the default Kiali SA token for login see here.
The Kiali dashboard displays.
Customize the view as follows:
- Select the Graph section from the sidebar.
- Under Select Namespaces (at the top of the page), select the
defaultnamespace, the location where the application’s pods are running. - From the third “pulldown” menu, select App graph.
- From the Display “pulldown”, toggle on Traffic Animation and Security.
- From the footer, toggle the legend so that it is visible. Take a moment to familiarize yourself with the legend.
Observe the visualization and note the following:

- We can see traffic coming in through the ingress gateway to the
web-frontend, and the subsequent calls from theweb-frontendto thecustomersservice - The lines connecting the services are green, indicating healthy requests
Such visualizations are helpful with understanding the flow of requests in the mesh, and with diagnosis.
Feel free to spend more time exploring Kiali.
We will revisit Kiali in a later lab to visualize traffic shifting such as when performing a blue-green or canary deployment.
Jaeger📜
Launch the dashboard, open in a new browser tab tracing.bigbang.dev:
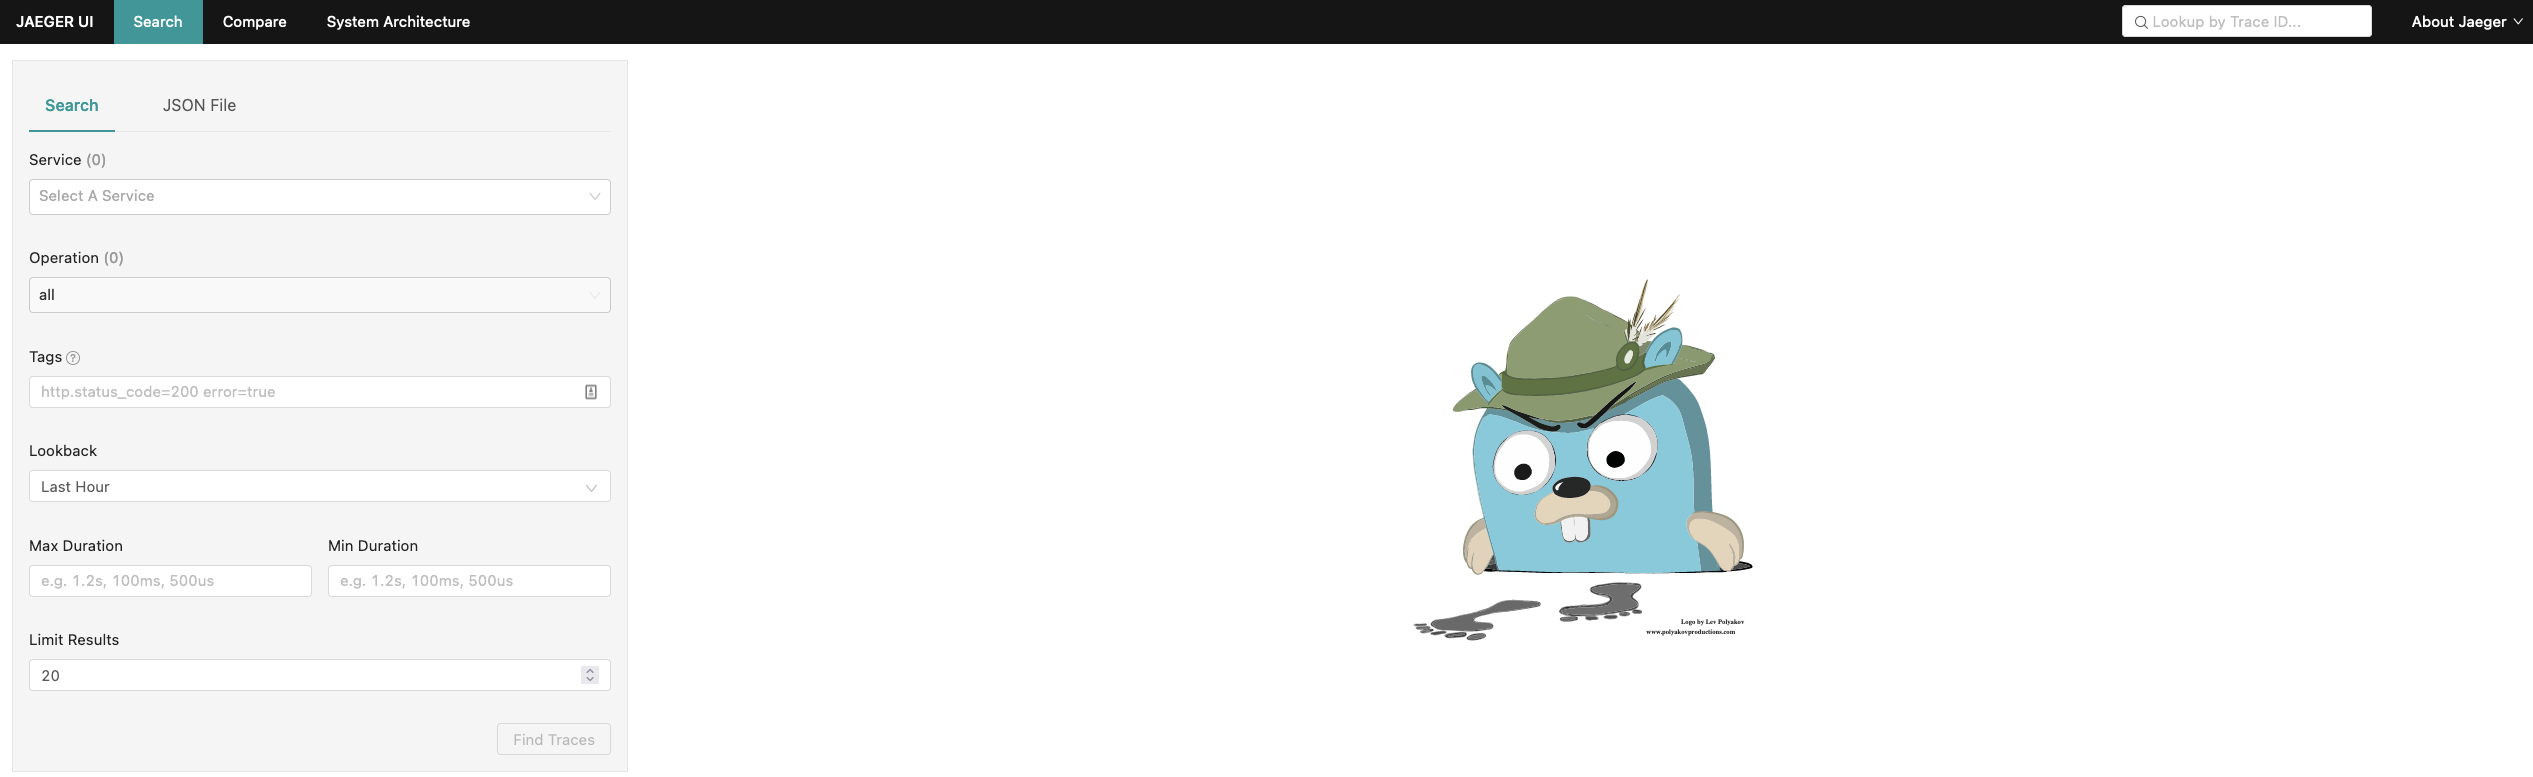
- Click on the service dropdown and select the service
web-frontend.default - Click on the Find Traces button (green) at the bottom.
A number of query results will display. Each row is expandable and will display more detail in terms of the services participating in that particular trace.
- Hover over and click to the right of one of the traces having four (4) spans.
The resulting view shows spans that are part of the trace, and more importantly how much time was spent within each span. Such information can help diagnose slow requests and pin-point where the latency lies.
Distributed tracing also helps us make sense of the flow of requests in a microservice architecture.
Prometheus📜
Prometheus works by periodically calling a metrics endpoint against each running service (this endpoint is termed the “scrape” endpoint). Developers normally have to instrument their applications to expose such an endpoint and return metrics information in the format the Prometheus expects.
With Istio, this is done automatically by the Envoy sidecar.
Observe how Envoy exposes a Prometheus scrape endpoint📜
-
Capture the customers pod name to a variable.
CUSTOMERS_POD=$(kubectl get pod -l app=customers -ojsonpath='{.items[0].metadata.name}') -
Run the following command:
kubectl exec $CUSTOMERS_POD -it -- curl localhost:15090/stats/prometheus | grep istio_requestsThe list of metrics returned by the endpoint is rather lengthy, so we just peek at “istio_requests” metric. The full response contains many more metrics.
Access the dashboard📜
-
Start the prometheus dashboard, open in a new browser tab
prometheus.bigbang.dev. -
In the search field enter the metric named
istio_requests_total, and click the Execute button (on the right). -
Select the tab named Graph to obtain a graphical representation of this metric over time.
Note that you are looking at requests across the entire mesh, i.e. this includes both requests to
web-frontendand tocustomers. -
As an example of Prometheus’ dimensional metrics capability, we can ask for total requests having a response code of 200:
istio_requests_total{response_code="200"} -
With respect to requests, it’s more interesting to look at the rate of incoming requests over a time window. Try:
rate(istio_requests_total[5m])
There’s much more to the Prometheus query language (this may be a good place to start).
Grafana consumes these metrics to produce graphs on our behalf.
Grafana📜
-
Launch the Grafana dashboard, open in a new browser tab
grafana.bigbang.dev.Tip
The default Grafana username is “admin” and the password value can be obtained as follows:
kubectl get secret -n monitoring monitoring-monitoring-grafana -o=jsonpath='{.data.admin-password}' | base64 -d -
Click on the magnifying glass and search for Istio to reveal pre-designed Istio-specific Grafana dashboards
- Explore the Istio Mesh Dashboard. Note the Global Request Volume and Global Success Rate.
- Explore the Istio Service Dashboard. First select the service
web-frontendand inspect its metrics, then switch to thecustomersservice and review its dashboard. - Explore the Istio Workload Dashboard. Select the
web-frontendworkload. Look at outbound services and note the outbound requests to the customers service. Select thecustomersworkload and note that it makes no outbound services calls.
Feel free to further explore these dashboards.
Next📜
We turn our attention next to security features of a service mesh.