Consolidated Logging
What is Consolidated Logging?📜
Breaking down complex systems into smaller parts increases the number of individual components generating log data. These logs are in multiple formats and spread across multiple servers. Centralized logging involves collecting logs from networks, infrastructure, and applications and storing them in one location for analysis. This feature lets administrators quickly identify and troubleshoot network issues by providing a consolidated view of all activity.
Consolidated Logging basics📜
-
A typical logging stack is made of 3 pieces:
- Collection/Shipper: Consumes log outputs and sends them to the consolidated logging framework.
- Storage: Stores the shipped logs.
- Visualization Tool: Allows users to search and view log data.
-
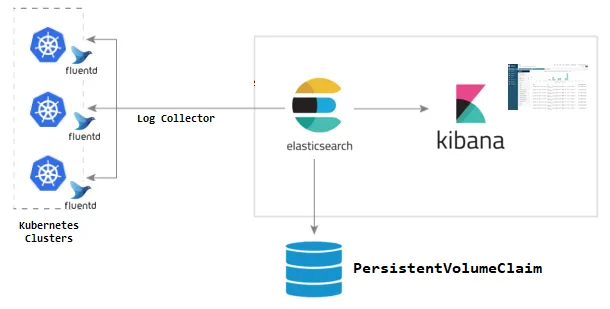
PlatformOne uses:
- Fluentbit for log collection, transformation, and shipping,
- ElasticSearch for log storage, and
- Kibana for visualization.
The diagram below shows how these work together. The diagram shows FluentD (another popular log collector), but the architecture is the same.
Fluent Bit📜
- Deployed as a Daemonset in the cluster. Runs on both worker and master nodes.
- Pushes logs to ES/ECK (Elastic Cloud on Kubernetes).
- Big Bang configures ElasticSearch with a logstash index that includes all Kubernetes pod logs.
Elastic Cloud on Kubernetes📜
Elastic Cloud on Kubernetes (ECK) helps make Day 2 operations easier with ElasticSearch.
Features include:
- Deploying and managing multiple Elasticsearch clusters, including Kibana.
- Simple scaling that allows you to grow with your cluster.
- Default security on every cluster.
Day 1 Operations
-
Deploy the Elastic-Operator.
-
Deploy an ElasticSearch cluster.
-
Deploy a Kibana instance.
Day 2 Operations
-
Upgrading to newer versions.
-
Scaling up to handle increased load.
Installation📜
ECK is deployed using the Operator pattern:
- ECK simplifies installing ElasticSearch by using custom resource definitions.
- The example below is very simple, but note that the production operator for Big Bang describes an Elastic Cluster declaratively in 189 lines.
- You can scale the cluster by simply increasing the count.
kubectl get elasticsearch logging-ek -n=logging -o yaml | wc -l
apiVersion: elasticsearch.k8s.elastic.co/v1
kind: Elasticsearch
metadata:
  name: quickstart
spec:
  version: 7.8.0
  nodeSets:
  - name: default
    count: 1
    config:
      node.master: true
      node.data: true
      node. ingest: true
      node.store.allow mmap: false
Kibana📜
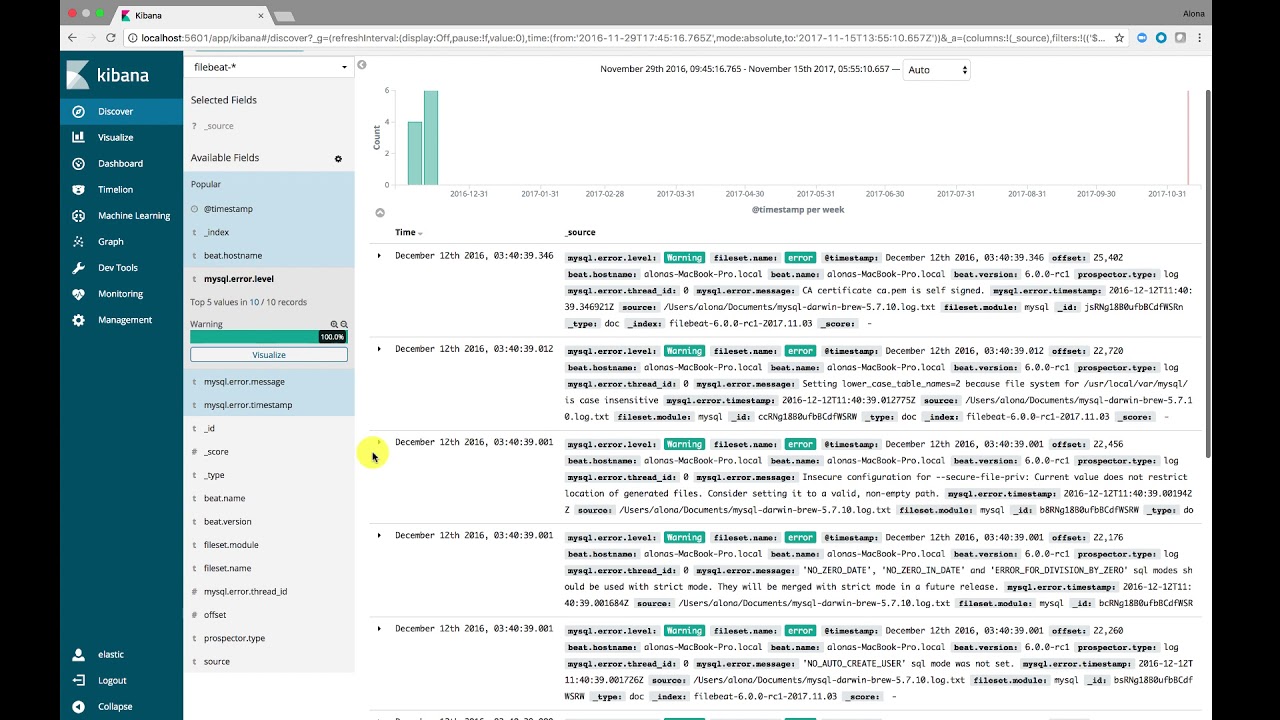
- UI for searching through indexed logs.
- Kibana is critical due to the short-lived nature of Kubernetes pods.
- Historical logs can be difficult to obtain from
kubectl.
- Historical logs can be difficult to obtain from
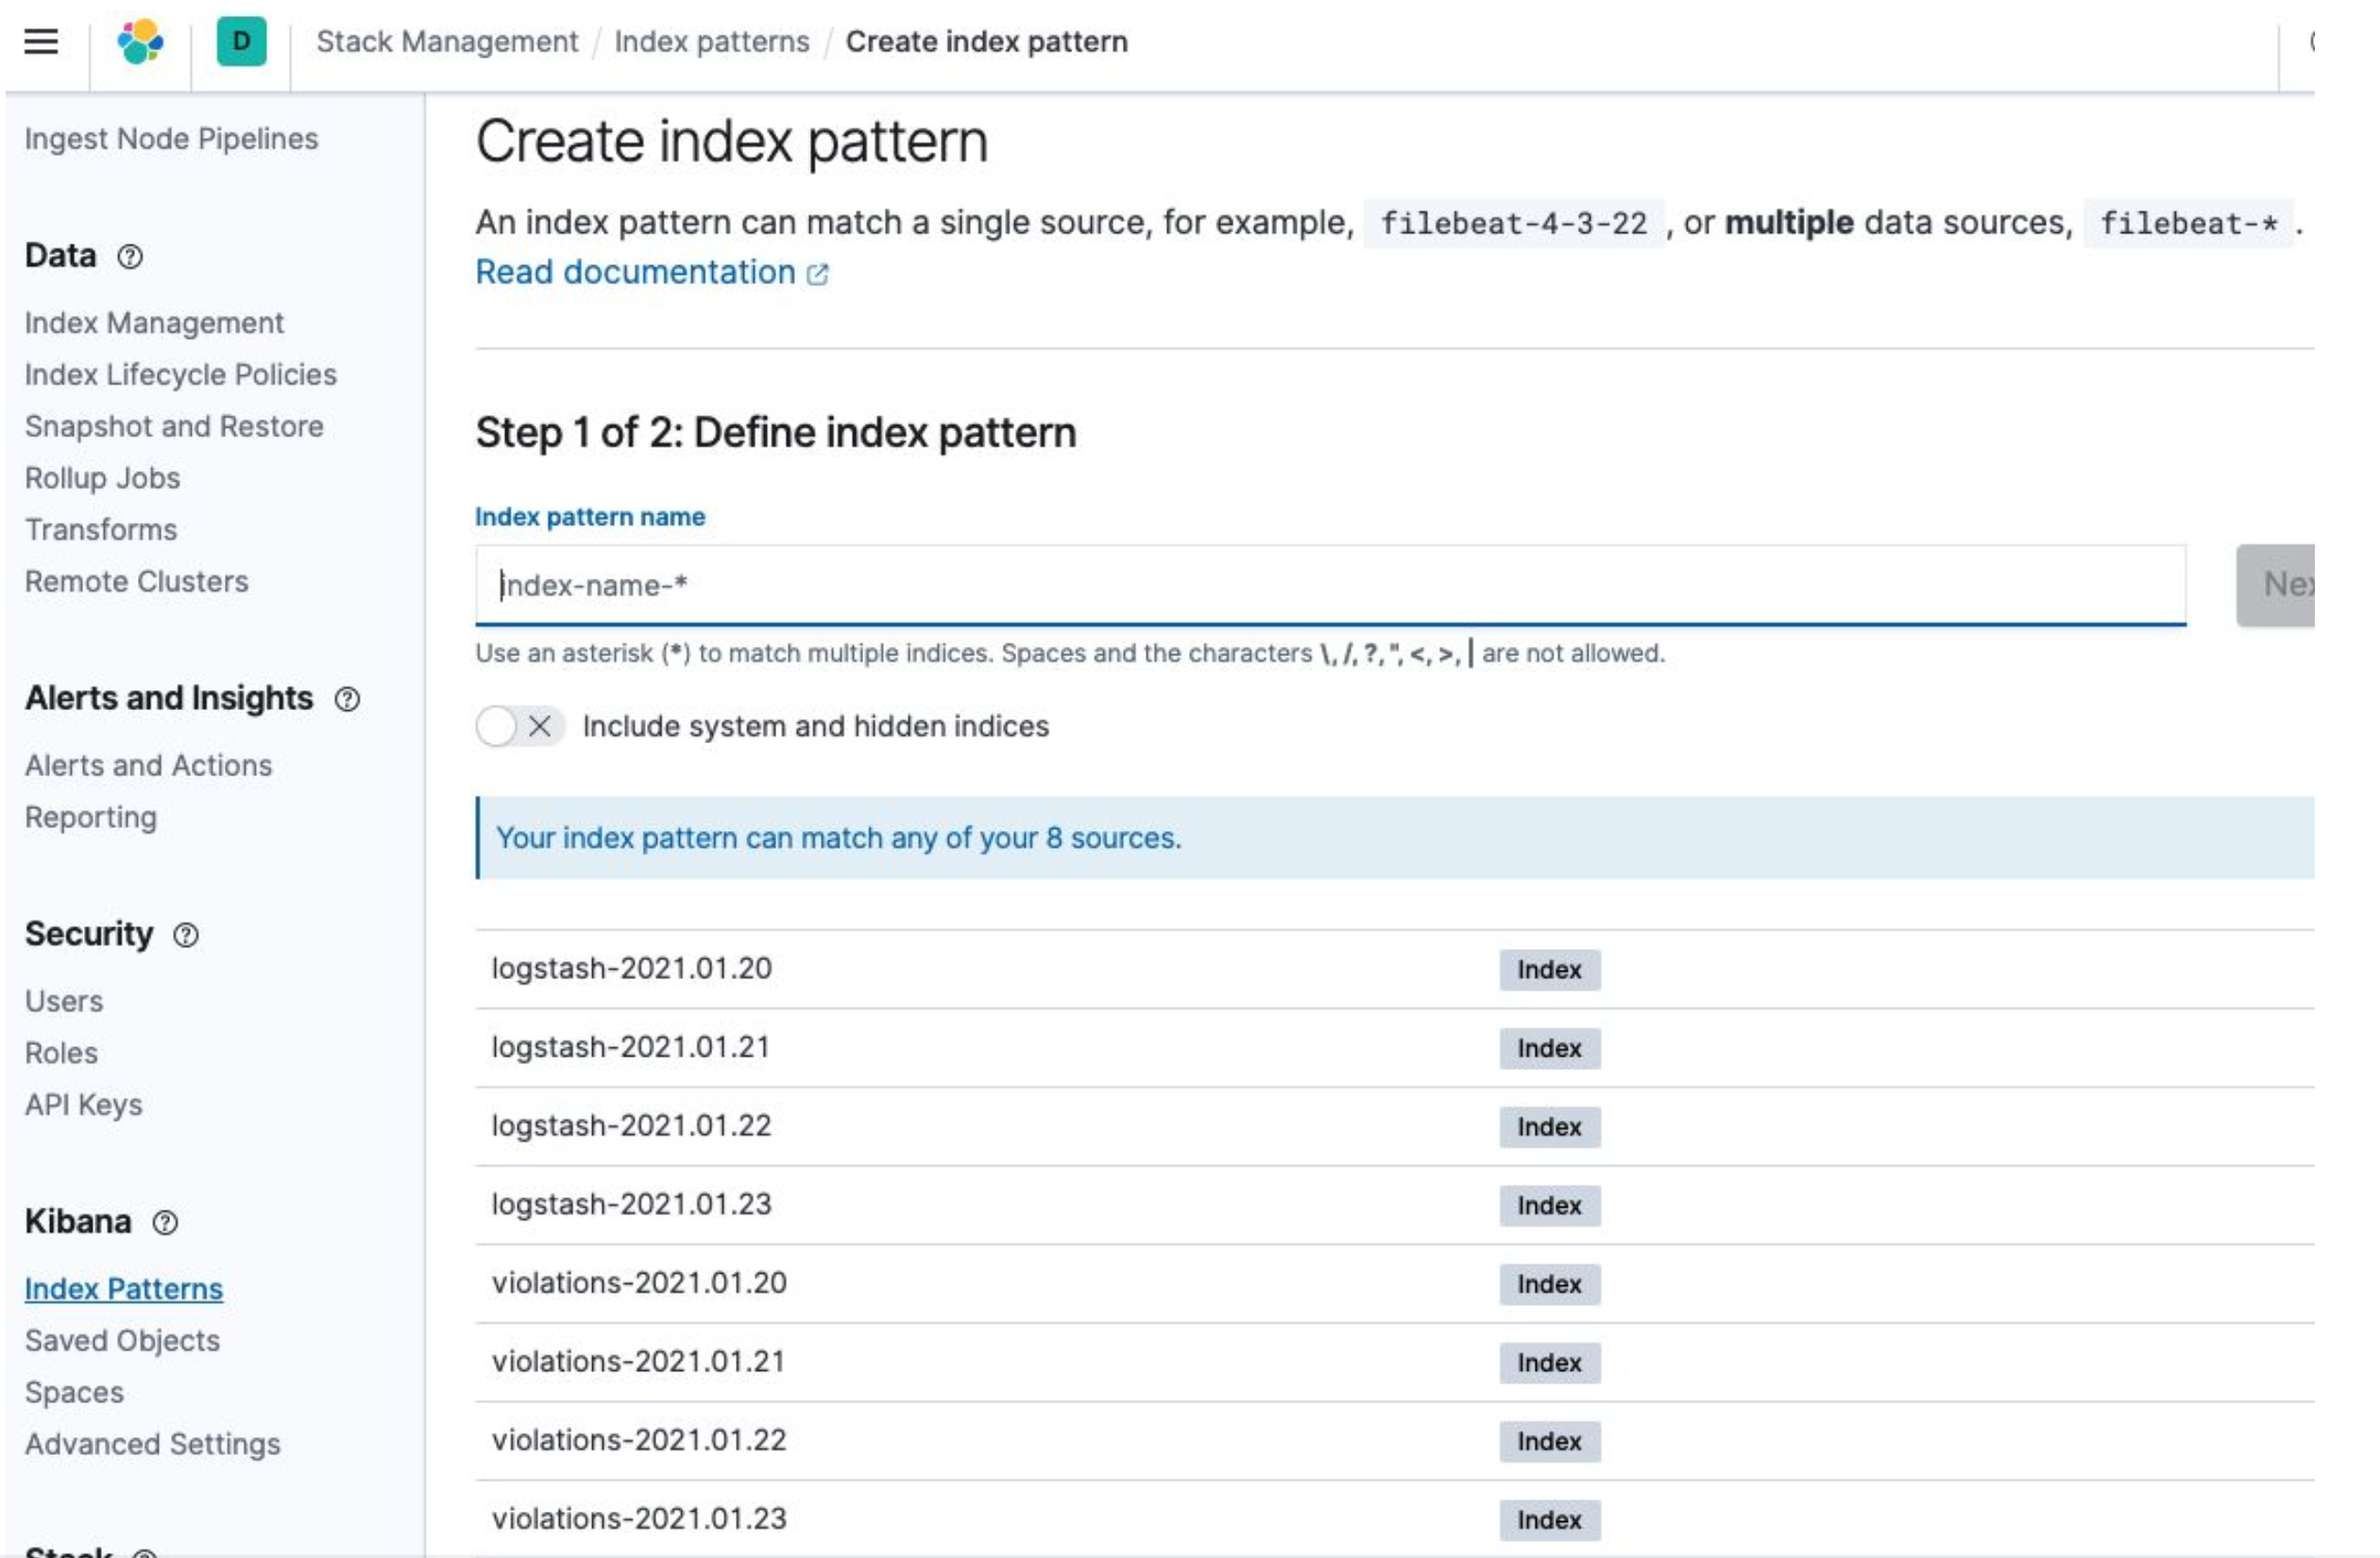
- First time login into Kibana will require a configuration of index patterns.
- An Index is created daily for Kubernetes logs and open policy agent gatekeeper logs. (This helps with rotating, compressing, exporting, and deleting older logs to free up space.)
- Index Pattern will look like logstash- or violations-
Quiz Questions📜
What is Consolidated Logging?
Consolidated Logging allows for the breaking down complex systems into smaller parts, increases the number of individual components generating log data.
These logs are in multiple formats and spread across multiple servers. Centralized logging involves collecting logs from networks, infrastructure, and applications and storing them in one location for analysis.
This feature lets administrators quickly identify and troubleshoot network issues by providing a consolidated view of all activity.
What are the 3 pieces in a typical logging stack?
-
Collection/Shipper: Consumes log outputs and sends them to the consolidated logging framework
-
Storage: Stores the shipped logs
-
Visualization Tool: Allows users to search and view log data
What are the 3 packages used in Platform Ones logging stack?
-
Fluentbitfor log collection, transformation, and shipping -
ElasticSearchfor log storage -
Kibanafor visualization
What is ECK? and what features does it include?
ECK stands for Elastic Cloud on Kubernetes and its features include: Deploying and managing multiple Elasticsearch clusters (including Kibana), simple scaling that allows you to grow with your cluster and default security on every cluster