Observability📜
When discussing observability, we usually group concerns about logging, metrics, and tracing within others. Istio provides easy access to metrics, logging, and tracing through its pre-built instrumentations enabled by Envoy.
Prometheus is a time-series DB that can scrape the Envoys for metrics regarding the traffic flowing through our mesh. Prometheus scans pods for specific annotations to collect and properly index metrics. For more information about Prometheus, read here.
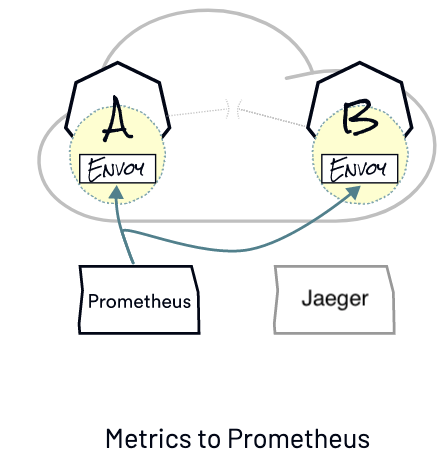
Once metrics are collected using Prometheus, you can display data visually using Grafana. Grafana is an open-source web application with centralized dashboards for analytics and interactive visualization. For more information about Grafana, read here.
In addition to Prometheus/Grafana, you can also install Kiali, Zipkin, or Jaeger. Kiali is the management console for Istio service mesh. This add-on can be installed and trusted as a reliable component of your production environment. Zipkin and Jaeger are Istio’s tools for distributed tracing.
BigBang includes Jaeger, Kiali, Prometheus and Grafana (monitoring) as part of its offerings. By default, Helm values are enabled for the installation of these.
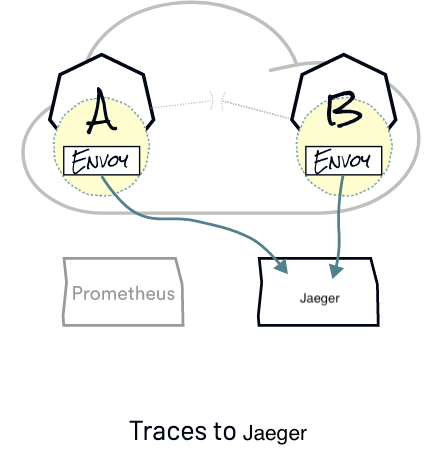
Users can track a request across multiple services with distributed tracing, allowing a deeper understanding of request latency, serialization, and parallelism via visualization.
Istio leverages Envoy’s distributed tracing features to provide tracing integration out of the box.
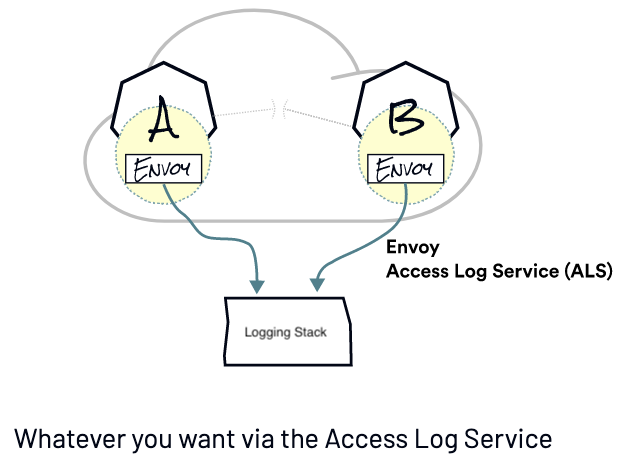
The Access Log Service (ALS) provided by Envoy helps address logging issues. It can be easily configured to work with any other logging system.
Next📜
The application is currently operational and accessible on the Internet.
In the next lab, we explore the observability features built into Istio.